Temperature-dependent properties
This example calculates the vapor pressure and produces a plot of vapor pressure against temperature.
import pyCRS
import matplotlib.pyplot as plt

mol = pyCRS.Input.read_smiles("CCCCCCO")

prop_name = 'vaporpressure'
pyCRS.PropPred.estimate(mol, temperatures=[290,295,300,305,310,315])
print("Results:", mol.properties_tdep[prop_name])

x,y = mol.get_tdep_values(prop_name)
unit = pyCRS.PropPred.units[prop_name]
plt.plot(x,y,'-o')
plt.ylabel(f"vapor pressure ({unit})")
plt.xlabel("Temperature (K)")
plt.show()
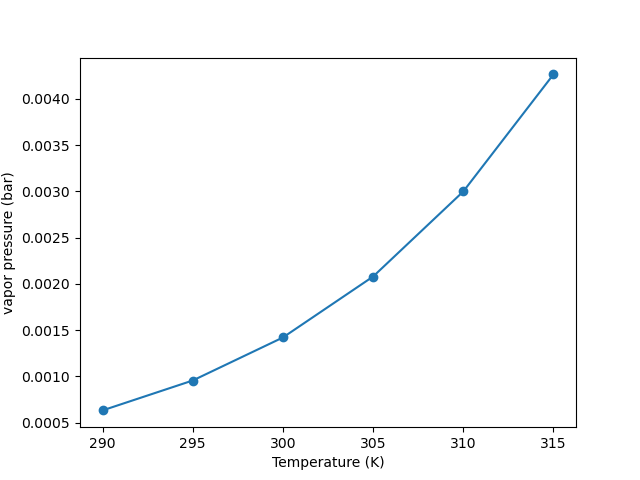
The output shows the format of the results: (temperature, vapor pressure) pairs
Results: [(290.0, 0.0006316340979498092), (295.0, 0.0009549864170162676), (300.0, 0.0014201952225525484), (305.0, 0.002079200184963613), (310.0, 0.0029991100667307634), (315.0, 0.004265490872465904)]
Finally, the plot produced is the following: